Request for analysis:
An automotive assembler was experiencing pinhole (or bubble) paint defects on their car hoods. The defects would appear as series of pinholes in long parallel lines on the painted hoods.
Objectives:
Methodology:
Metallographic cross-sections were prepared of several pinhole defects. These were then examined using scanning electron microscopy (SEM) combined with energy dispersive X-ray (EDX) spectroscopy. Elemental X-ray intensity maps were collected in order to show the distribution of various elements of interest.
Results of the study:
The SEM image and elemental X-ray intensity maps for iron, carbon and zinc were collected from the cross-sectioned defect area. The iron map represents the steel substrate, the carbon map represents the paint layers and the zinc map represents the galvanneal and zinc phosphate layers on the steel substrate. These images show that there is a crack or metal flap directly below the pinhole defect. The X-ray maps show that both carbon and zinc are present under the metal flap. The presence of zinc under the flap indicates that the metal flap occurred in the steel substrate prior to galvanizing and phosphating. The carbon-rich areas most likely represent residue from rolling oils trapped as the metal flap was compressed during rolling.
This defect was traced to small flaps of steel being pulled from the surface and then repressed into the surface during the steel rolling process. Rolling oils and air were trapped under the metal flap and are volatilized when the painted hoods are baked. The expanding gas formed bubbles in the paint that appear as small pinhole defects. The assembler was able to use this evidence to recuperate lost revenue from these defective hoods.
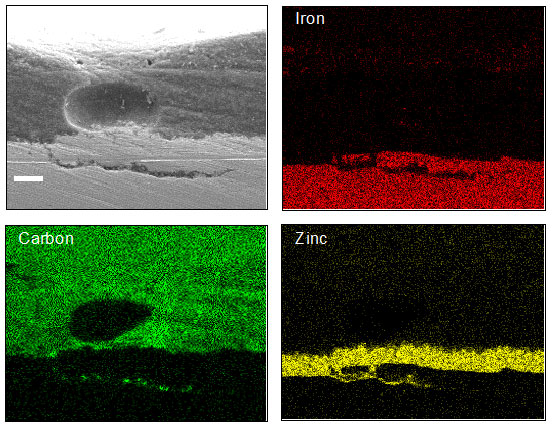
Figure 1: SEM image (top, left) and elemental X-ray intensity maps showing the distribution of iron, carbon and zinc.