Request for analysis:
Metallurgical testing on a poly metallic Cu/Pb/Zn ore indicated either copper or lead activation of sphalerite in a Cu/Pb flotation test.
Objective:
To establish and rank the factors controlling sphalerite flotation.
Methodology:
The surface composition of individual sulphide grains was examined by TOF-SIMS and comparative analyses of the surface chemistries on sphalerite grains from the feed, concentrate (fast floating particles) and tails (rejected particles) were performed.
Results of the study:
Both Cu and Pb were identified on the surface of the sphalerite grains examined. Figure 1 shows a Zn map (secondary ion image of Zn in the concentrate sample) along with an example of the positive ion spectra from the surface of sphalerite grains from the concentrate and tail samples in the mass region of Pb (Pb isotopes 206, 207 and 208 are shown). The spectra clearly illustrate peak positions and windows identified for peak (mass) intensity measurements.
Activators species on surface of sphalerite:
Plots of normalized counts for Pb and Cu on the surface of the sphalerite grains from the feed, concentrate and tails samples (Figure 2) reveal that:
Depressant species on surface of sphalerite:
Potential depressant species: Ca does not appear to be favoured on either the concentrate or tails sphalerites; Mg appears to be slightly more abundant on the sphalerites in the tail samples (Figure 3).
Statistical comparison of sphalerite surface composition between concentrate and tails:
The data in the scatter plots is emphasized in the T-test comparison analyses (Figure 4). T-test values for mass species that exhibit statistically significant differences at 95% confidence level will be presented in a green colour on the T-test graph, while species with t-values that are not as statistically significant will be presented in a grey colour.
Relevant mechanisms based on surface analyses:
Cu versus Pb activation:
Major findings:
TO
Figure 1. Secondary ion image (map) for Zn in the concentrate. Area in the image is 300×300µm. Positive ion spectra from the surface of sphalerite in the concentrate and tails in the mass region for Pb (205.5 to 208.5 amu). The data in the spectra are normalized by total ion intensity.
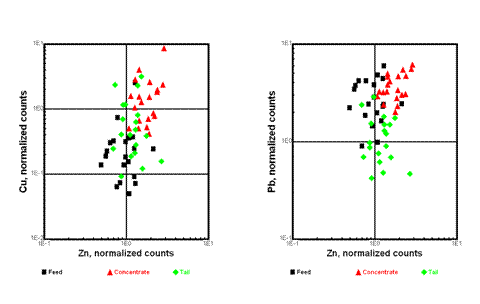
Figure 2. Scatter plots showing the distribution for Pb and Cu versus Zn on sphalerite surfaces in the feed, concentrate and tail. The data are normalized by total ion intensity and area.
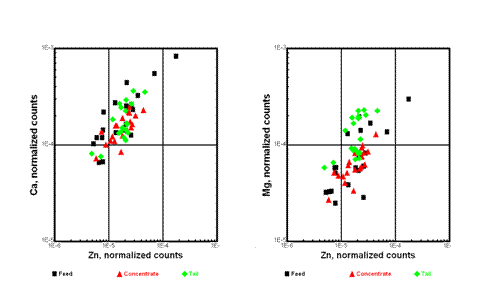
Figure 3. Scatter plots showing the distribution for Ca and Mg versus Zn on sphalerite surfaces in the feed, concentrate and tail. The data are normalized by total ion intensity
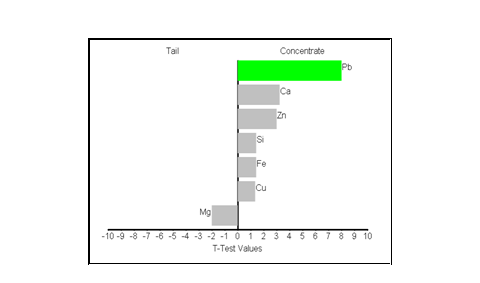
Figure 4. T-test statistical analyses for data from sphalerite grain surfaces from concentrate/tail flotation tests. All data in the tests were normalized by the total ion intensity and area. The surface components in bright green are considered to be statistically different between the concentrate and tail samples